ИКТ функция 1 курс. Exercise 1
 Скачать 1.62 Mb. Скачать 1.62 Mb.
|

|
ogression. The formula of the n-th member of the arithmetic progression:an=a1+ Exercise 1.C reate the table that calculates the n-th term and the sum of the arithmetic progression. The formula of the n-th member of the arithmetic progression: an=a1+d(n-l) and the sum formula of the first n terms of the arithmetic progression: Sn=(a1+an)*n/2, where a1 is the first term of the progression, a d is the difference of the arithmetic progression, using the absolute reference. The first term, which is equal to -2, and the difference is 0,725. Click on Sheet1. Rename it to Exercize1. Write down the formulas yourself.  Exercise 2.Construct a graph of the function y = cos2 (2x) sin (x) + e-x│x│ for x in steps of 0.1. Create the following table on sheet 2: fill in the values of the variable x with the fill marker. In cell B3 enter the formula: = cos (2 * A3) ^ 2 * sin (A3) + EXP (-A3) * ABS (A3), copy the formula to the remaining cells. Select the values for the function and start the Chart Wizard. Select the chart type - Graph. In the Row tab, in the X-Axis signatures, select the range of X values. 6. Place the chart in this sheet and rename sheet 2 as the Function Graph. Exercise 3.Attestation was conducted on 3 subjects and it is necessary to determine whether a student is certified in all subjects. Go to Sheet3. Rename it to Ex3. Fill the table according to the sample. 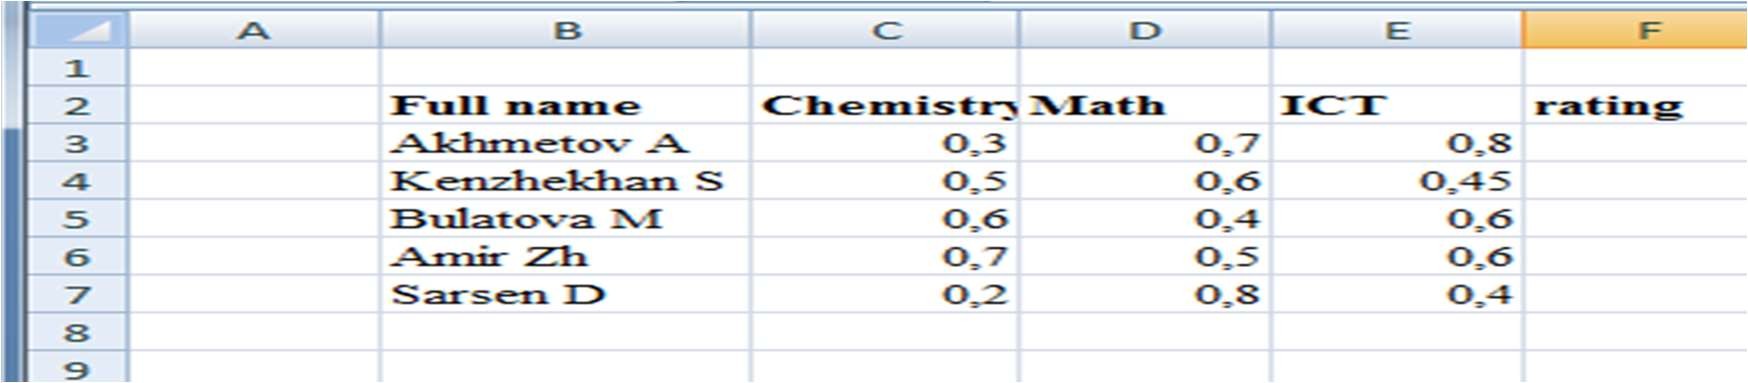 The values must be written in percentages. For this: Select the range B3: D7. Clickl the context menu → Format cells.Go to the Numbers tab. Number format select Percentage, Set the number of decimal places to 0. In cell F3, click the IF function. 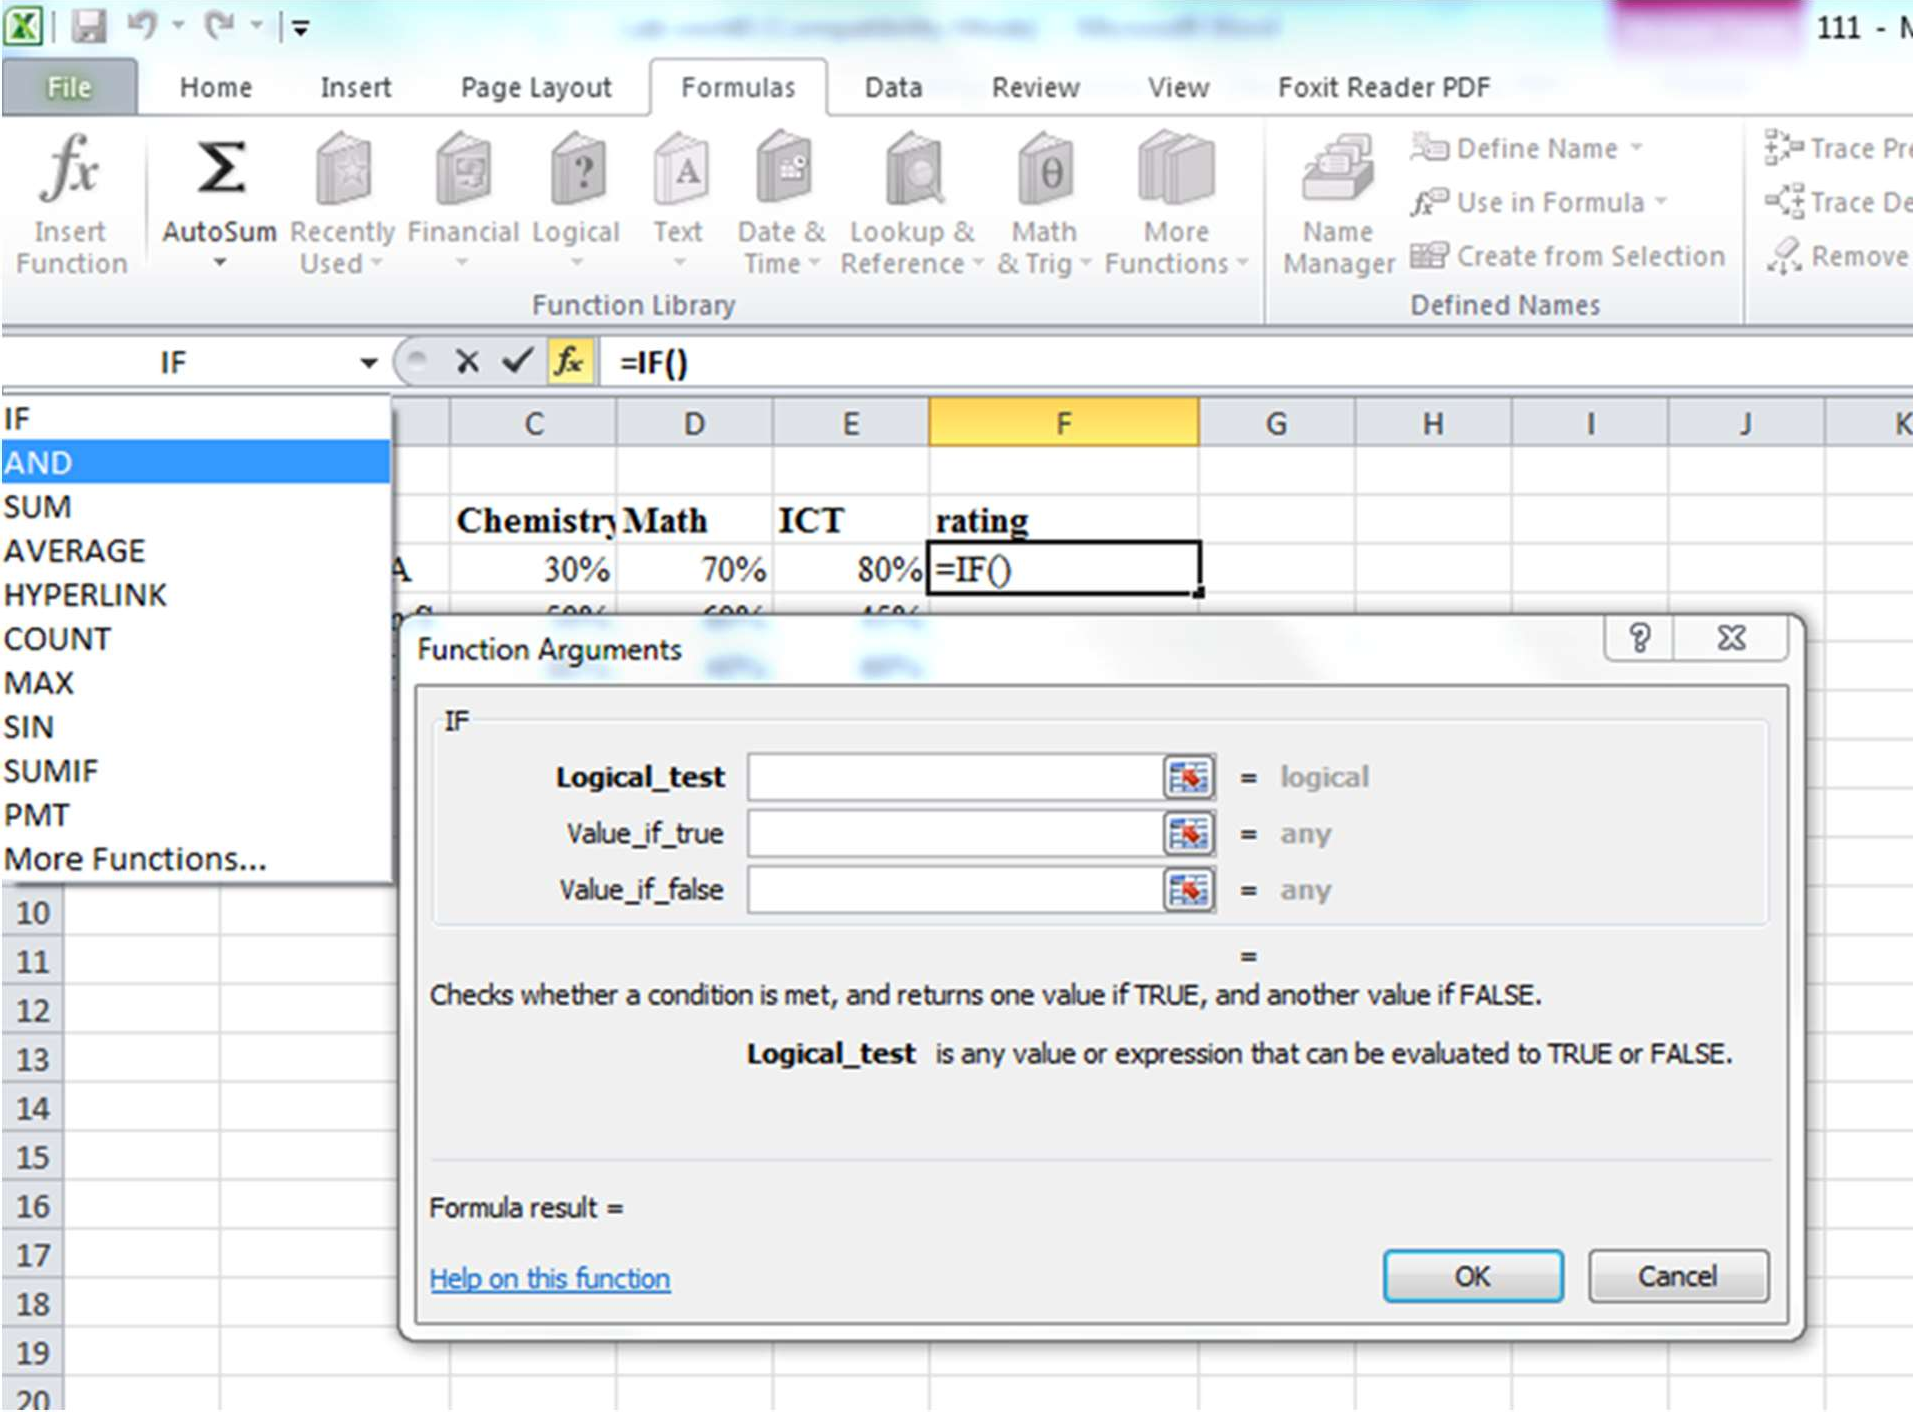 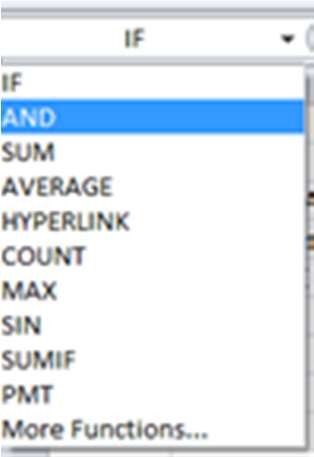 At the level of the formula line on the left side, click on At the level of the formula line on the left side, click onIn the list, select Other functions, in the Logical category, select the function AND. In the field Logical_value1: B3> = 50%, Logical_value2: C3> = 50%, Logical_value3: D3> = 50%. Click in the formula bar on the IF. In the field Value if true, type the words: "attestation" In the Value field, if you want to type words: "not attestation" Click on OK The result should be stretched for other cells. 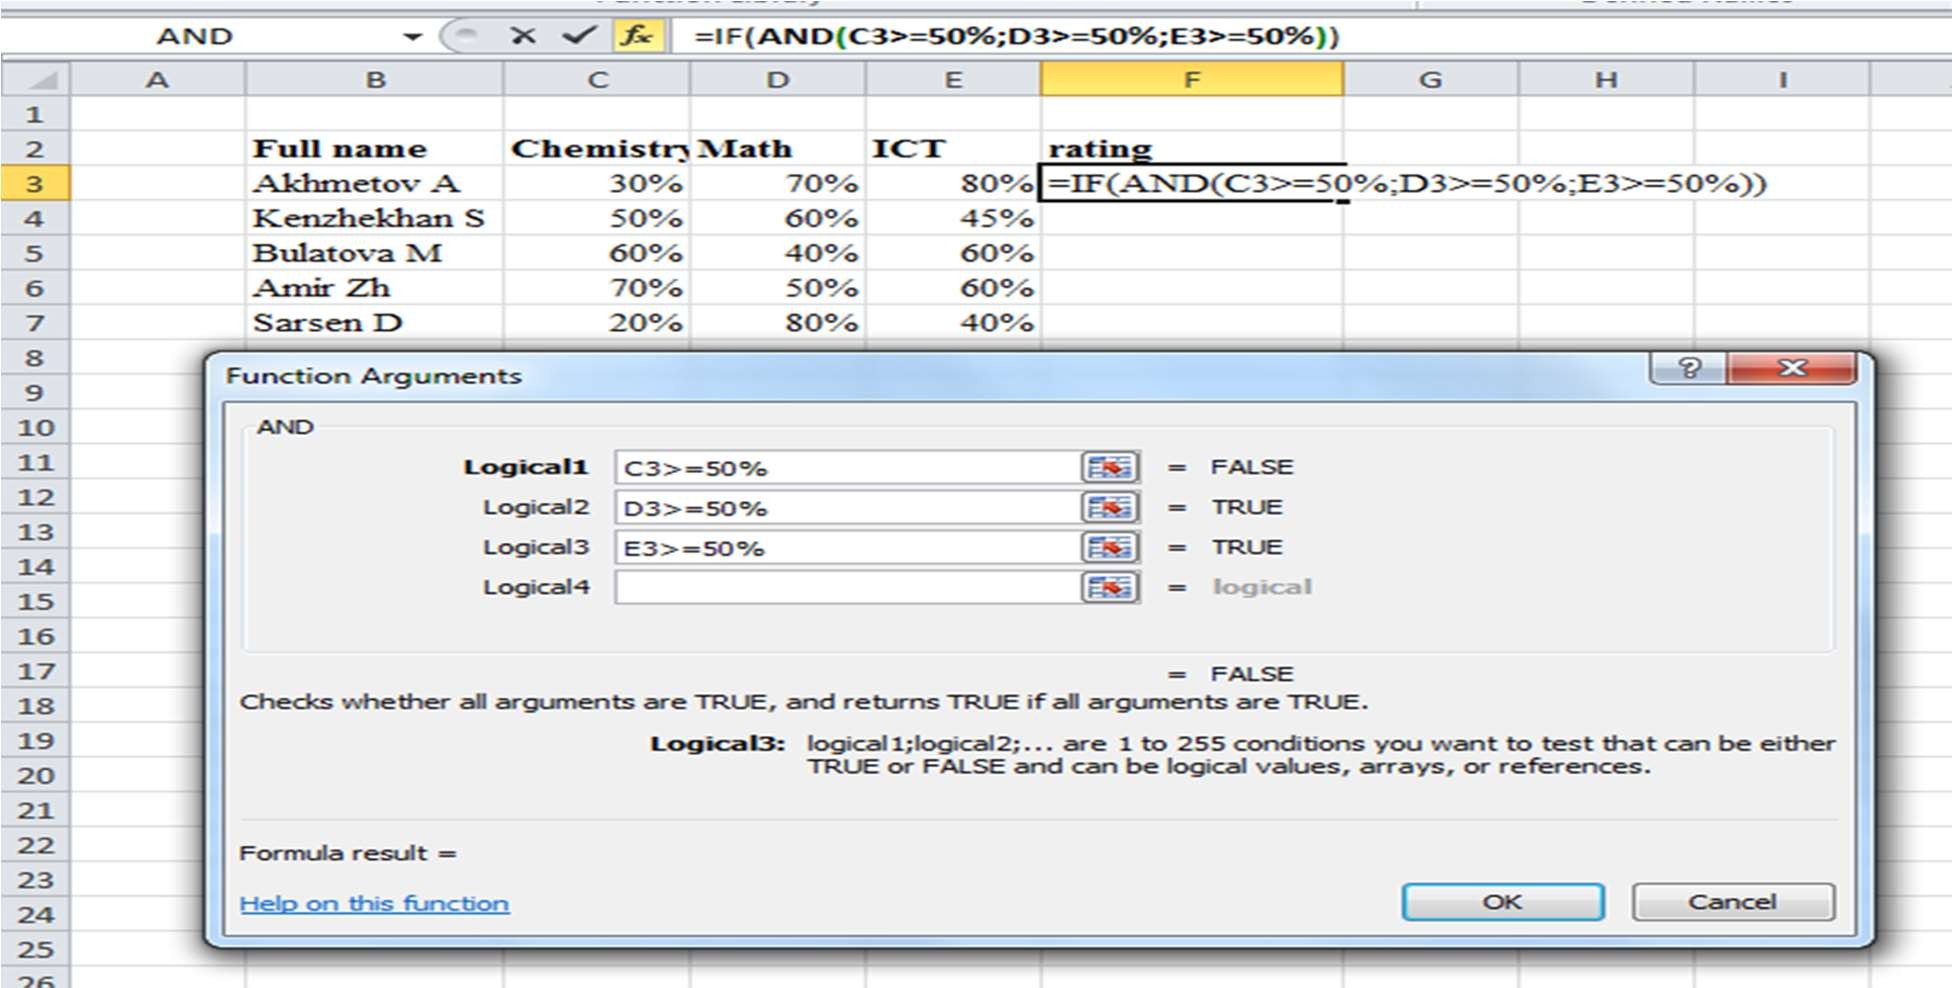 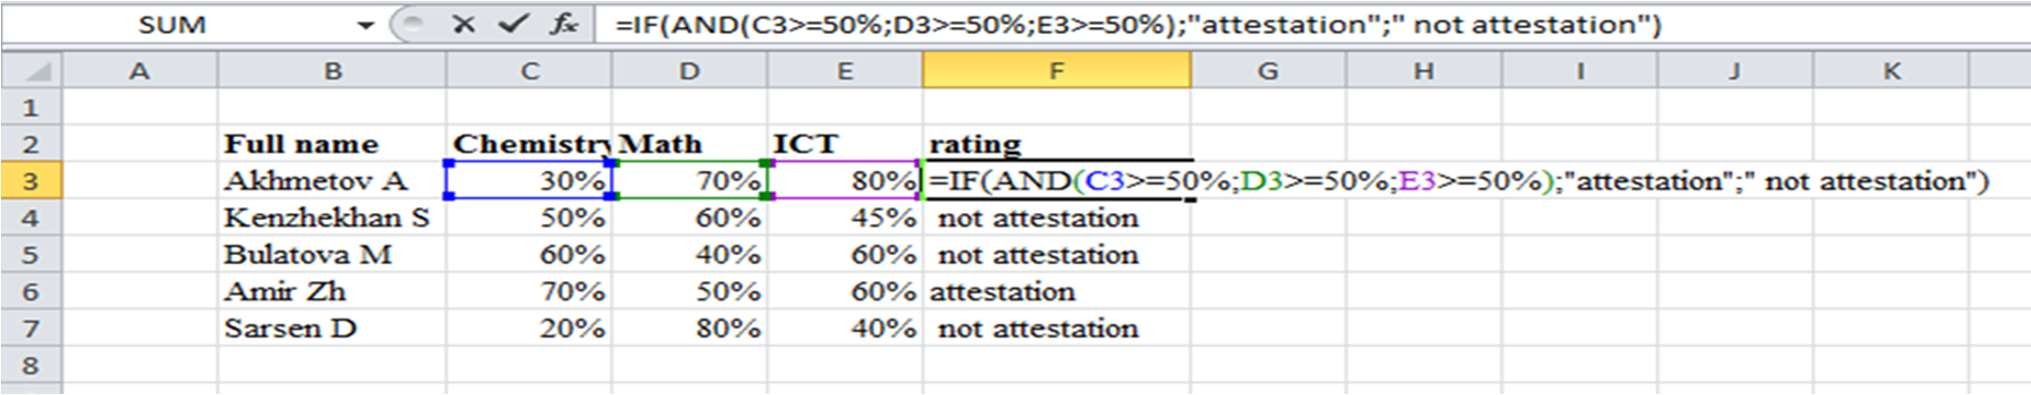 Exercise 4Building 3D Surface Plotsz 3x2 2sin2 ( y) y2 Ex_4деп аталатын жұмыс бетін құрыңыз. x,y1;1 х-тің мәндерін 0,2 қадаммен А2 ұяшықтан бастап баған түрінде енгізіңіз; у-тің мәндерін 0,2 қадаммен В1 ұяшықтан бастап жол түрінде енгізіңіз; В2 ұяшыққа формула: =3*А2^2 – 2* SIN(B1)^2*B1^2 жазыңыз; Формуланы жазып болғаннан кейін оны қалған ұяшықтарға көшіру кезінде адрестердің дұрыс өзгеруін бақылап көріңіз, қорытынды жасаңыз: х-тің мәндері барлық уақытта А бағанында болуы керек, сондықтан баған өзгеріп кетпес үшін оның алдына абсолют адрестің белгісі қойылады, яғни $А болады, ал у-тің мәндеріне сәйкес бірінші жолдың адресі $1 болып өзгереді. Ендеше осыған сәйкес В2 ұяшықтағы формуланы: =3*$А2^2 – 2* SIN(B$1)^2*B$1^2 түрге келтіреміз; z–тің қалған мәндерін толтыру маркерін пайдалана отырып, шығарыңыз; Ол үшін В2:В12 диапазонды белгілеп алып толтыру маркерін сәйкес тіктөртбұрышты обылыс толғанға дейін созасыз;. 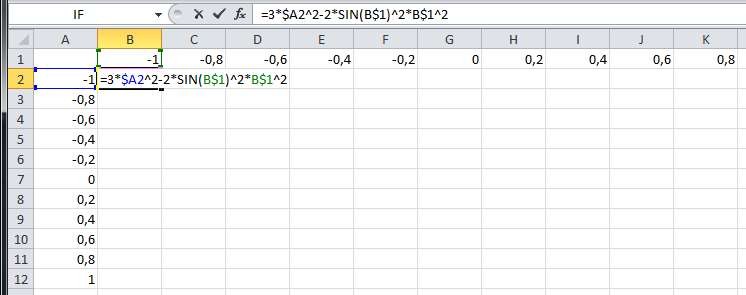 9-сурет Кестеніх, у, z. мәндерімен қоса белгілеп алыңыз; Диаграмма шеберін (Charts) шақырыңыз, диаграмма типіненSurface(1-ші түрін ) таңдаңыз; Диаграмманың параметрлерін өзгертіңіз; Диаграмманы сол бетке орналастырыңыз, атын Surface деп өзгертіңіз. 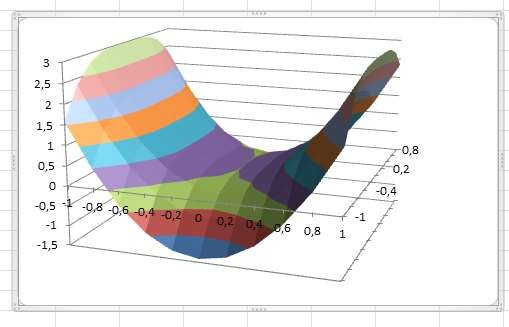 Tasks for independent work:You should build х, у =[-1;1], Z= surface according to the following tasks
Control questions:What is a spreadsheet? What types of addressing you know? How do they difference from each other? What is a chart? How can you create charts? Could you tell about the types of charts? What kind of ways can you enter a function in Excel? What categories of functions do you know? Give me examples of statistical functions, which you know Give me examples of math functions, which you know Give me examples of logical functions, which you know |