Основы ИБ. Фан_6363_лаб-7-23.12. Отчет по лабораторной работе 7 по дисциплине Основы информационной безопасности Тема а нализ рисков с использованием программного обеспечения RiskWatch 1
 Скачать 185.49 Kb. Скачать 185.49 Kb.
|
|
1.3 Risk Analysis Methodology The automated risk analysis program is based on a standardized methodology which has been developed through the collective experiences and expertise of security consultants and analysts that have actually performed a multitude of risk analyses. In accordance with this methodology, members of the analysis team familiarized themselves with the physical facilities, overall organizational structure, and the integration of the data processing system into the structure of the organization. Following a study of the working relationships within the organization, a project plan was prepared. A list was made of all the organizational elements which either support or draw support from the system under analysis. Work assignments were then made for the team members to assess the threats to the data processing system. The team then collected all readily identifiable data necessary for a quantitative risk assessment. Included were computerized lists of assets, floor plans, etc., and documentation on policies and procedures. After the collected data was analyzed, the function of each component of the organization was identified and the mission of the organization was defined. As a result of this analysis, the critical components of the organization were discovered and analyzed in depth. From the data collected, an organizational resource structure was identified for all assets (both tangible and intangible) used either directly or indirectly, in support of the organizational mission tasks and functions. The assets were classified according to their criticality, sensitivity, or use within the organization. A number of questionnaire diskettes were prepared and distributed to COMPANY IBS and NAME employees, and to NAME and non-NAME users of COMPANY IBS data center to identify any vulnerabilities that may be present at the data center. Based on an examination of the organization's related functions and assigned resources, a list of applicable threats was developed. Each threat listed could, if realized, cause a significant loss of organizational assets, and consequently, a significant loss of the ability to carry out some facet of the mission. To analyze the vulnerabilities, an analysis was made of each asset, and the threats which could act against it. For each asset/threat/vulnerability combination, a determination was made and a numerical value was assigned which represented the actual percentage of the value of the asset which is exposed and subject to loss if the threat were to occur. Given the value of the asset and the percentage of that value exposed to each threat, a computation was made of the loss which could be expected for each occurrence of the threat - regardless of the likelihood that the threat would occur. For each of the threats identified as applicable, the adequacy of the protection afforded by existing controls and safeguards was assessed based on responses to the RiskWatch questionnaires. Given the nature of the threats previously identified, a determination was made (by conducting extensive research of many data bases, both automated and manual), of the threat's frequency of occurrence within any given year. The determination of these factors involved both data collected from within the organization through the questionnaire evolution, and various data bases obtained from over 100 sources by a variety of access modes, from direct on-line to mag-tape copies, microfiche or hard copy media. The data were then analyzed by statistical routines to obtain the mean, standard deviation, confidence interval, and dependent variables acting as maximizing factors. Multiplication of the value of each asset, times its vulnerability exposure to each threat which might affect it, resulted in the estimated loss per occurrence for the asset. This estimate was multiplied by the Annual Frequency Estimate of the threats to annualize the loss expectancies (ALE) for the asset, threat, and vulnerability combination The estimated loss per occurrence and the Annual Loss Expectancies attributed to the various assets affected by a given threat were summed and an analysis was made of the impact such a threat occurrence would produce. The analysis involved evaluating details relating to the physical and logical interrelationships of all the components, both within and outside the organization, which would be affected. The result of this analysis was a realistic impression of the snowball effect that the threat could produce. The figures produced represent the total direct and indirect losses which could be anticipated by all parties, both within and associated with the organization. A series of safeguards was then identified to address each threat with a high percentage of occurrence. In each case, recommended additional safeguards had to be cost-effective, unless they were specifically required by law, regulation, or contractual agreement. The cost of implementing and operating the safeguard had to be less than the reduction in the (ALE) associated with the threats against which a safeguard was effective unless specifically required by law. Costs and savings were amortized over the lesser of the estimated safeguard, system, or facility life cycles. Money to be spent or saved in future years was discounted to reflect its value at the present time by using discount factors based on the inflation adjusted, cost-of-capital rate of 10%. Multiple effects -- that is, the reduction of more than one ALE, from more than one threat, by a single additional safeguard -- were evaluated by analyzing the difference in ALE of all affected threats. After applying these analytical techniques to the costs and savings associated with each proposed additional safeguard and the ALE's which it affected, a savings figure, normalized to the present time, was obtained, to assist management in deciding whether or not to implement the recommended additional safeguard. I. Executive Summary Scope This risk analysis was limited to COMPANY IBS Data Center. [[[Minicomputers and microcomputers were included in the analysis only to the extent they posed a risk to COMPANY IBS.]]] Risk Analysis Steps Questionnaire diskettes or network sub-directories were developed containing [[[532]]] questions covering all areas of COMPANY IBS AIS security; [[[One hundred eleven]]] COMPANY IBS employees and users of the COMPANY IBS answered and returned the responses to the questions; The RiskWatch software determined COMPANY IBS vulnerabilities based on information on diskettes; Identified vulnerabilities were validated by COMPANY IBS management; A risk analysis report was prepared. Key Risk Analysis Report Findings Assets [[[ The asset replacement cost for COMPANY IBS is approximately $100M. Hardware, personnel (government and contractor), and intangibles (reputation) are the major asset categories at COMPANY IBS. Important assets, such as system software, applications, and databases can be replaced relatively inexpensively because they are backed-up. ]]] Vulnerabilities [[[ The risk analysis identified 170 vulnerabilities covering twenty-two vulnerability areas. COMPANY IBS is most vulnerable in five areas: (see Figure 1) The labeling and control of output listings. The security of remote terminals. The level and extent of security training. The level of staffing and separation of duties at the DATA CENTER. The level of training for the identification of Privacy Act records and insufficient labeling of Privacy Act-related materials. A physical survey of DATA CENTER revealed four fire detection and control vulnerabilities not identified by the questionnaire diskettes (see Chapter VII). ]]] Threats [[[ The four most significant threats to COMPANY IBS on an annual basis are: (see Figure 2) Data Destruction Misuse of the Computer Theft of Assets Data integrity loss. ]]] Safeguards [[[ The safeguards with the greatest return on investment, which are also among the least costly safeguards, are: (see Figure 3) Property Management Organizational Structure Visitor Control Security Plan Application Control ]]] II. Recommendations [[[One hundred seventy]]] vulnerabilities were identified which, if not corrected, could result in considerable loss to COMPANY IBS. Immediate steps which can be taken are: [[[ Correct the fire detection and control vulnerabilities identified during the walk-through. Publish and disseminate COMPANY IBS Disaster Recovery Plan. Develop a system-generated cover page for and improve the control of sensitive output listings. Review the security of terminals at the Parkview Building. Test the adequacy of current system software and user file backups. Remind users of the importance of backing up tape files. Provide additional training on and enforce existing security policies and procedures. Publish and disseminate an COMPANY IBS-wide policy on the handling of sensitive documents and develop a uniform cover sheet for these documents. Review COMPANY IBS staffing and separation of duties. COMPANY IBS System Security Officer, in coordination with COMPANY IBS management, should develop a Risk Management Plan to address the implementation of the safeguards with the greatest return on investment. ]]] [[[ Twelve major safeguards (see CHAPTER IX., Applicable Safeguard Cost Benefit Analysis Summary Table) were recommended which, if implemented, would substantially reduce losses if these threats occurred or prevent the threats from occurring altogether. COMPANY IBS System Security Officer should develop a Risk Management Plan in cooperation with COMPANY IBS management, who will make the final decision as to the selection of applicable safeguards. The Plan will identify the specific steps required to implement the selected safeguards and recommend to COMPANY IBS management the priority for safeguard implementation. ]]] 2.2 ASSETS WITHIN CATEGORY Assets are identified, by category, by commonly used name; associated with each individual asset there is other related information. Depending on the asset category, other data is also provided for each asset. This will include the level of sensitivity for data, the quantity of a duplicated hardware item, etc.. When the information is available, an indication is included about the basic attribute(s) of each assets that states whether the asset is critical (in the sense that the mission of the enterprise depends on the correct and timely functioning of this asset), or financial (with respect to the need to control modification), or sensitive (with respect to disclosure), or supportive (non of the above). The definition of each asset category is also provided The monetary values assigned represent the estimated replacement or purchase cost of the asset, not its current value. For example, the recruitment cost, the training cost, and the staff salaries and benefits were used to determine personnel costs. For leased equipment, replacement cost of obtaining a new lease is used since the organization is responsible for obtaining a replacement resource. The value of sensitive resources could be greater than the replacement value to account for the loss of future opportunity and the extent of exposure that agencies have resulting from the disclosure of data subject to the Privacy Act; awards of $1,000 to $5,000 per individual record have been assessed by the courts based on the sanctions included in the Privacy Act of 1974. The sections below deal, in turn, with each of the asset categories included in the analysis. 2.2.1 Accounts Payable There are no assets in this category. 2.2.2 Accounts Receivable There are no assets in this category. 2.2.3 Applications There are no assets in this category. 2.2.4 Cash Accounts There are no assets in this category. 2.2.5 Communications Hardware Asset Replacement Cost Percentage of Total Loss CH $1,000. 100.0% Figure 7.5 This information about replacement costs is presented below as a barchart.  Figure 8.5 2.2.6 Communications Software Asset Replacement Cost Percentage of Total Loss CS $20,000. 100.0% Figure 7.6 This information about replacement costs is presented below as a barchart.  Figure 8.6 2.2.7 Databases Asset Replacement Cost Percentage of Total Loss of databases $2,000. 100.0% Figure 7.7 This information about replacement costs is presented below as a barchart.  Figure 8.7 2.2.8 Documentation Asset Replacement Cost Percentage of Total Unauthorized access to documentation $1. 100.0% Figure 7.8 This information about replacement costs is presented below as a barchart.  Figure 8.8 2.2.9 Facilities Asset Replacement Cost Percentage of Total Breakage of one PC $580. 100.0% Figure 7.9 This information about replacement costs is presented below as a barchart.  Figure 8.9 2.2.10 Hardware Asset Replacement Cost Percentage of Total Insufficient capacity $18,000. 100.0% Figure 7.10 This information about replacement costs is presented below as a barchart.  Figure 8.10 2.2.11 Intangibles There are no assets in this category. 2.2.12 Personnel There are no assets in this category. 2.2.13 Procedures There are no assets in this category. 2.2.14 Security There are no assets in this category. 2.2.15 Support Systems There are no assets in this category. 2.2.16 System Software There are no assets in this category. CHAPTER 2. ASSETS The COMPANY IBS risk analysis included 16 asset categories. [[[Some of the categories were divided into more descriptive sub-categories. For example, communication consisted of three resource names (Communication Support Hardware, Communication Diagnostic Equipment, and Communication Modem/DSU).]]] The determination of categories and values of assets was accomplished through interviews with [[[NAME and NAME personnel]]]. A review of the assets was performed by the Risk Analysis Team and COMPANY IBS [[[and NAME]]] management. The asset values were determined based on the cost of replacing the particular asset. The largest replacement value was for Communications Software, which is estimated at $20,000. (see Figure 4) and which constitutes 48.1% (see Figures 4 and 6) of the total value of all DATA CENTER assets. The next highest values for replacement cost were for categories Hardware and Databases. The values and percentages of the whole are, respectively, $18,000., at 43.3% and $2,000. at 4.8%. 2.1 SUMMARY OF ASSET CATEGORIES The following table provides a summary of the total replacement costs for each of the asset categories considered in the analysis. Asset Category Replacement Cost Percentage of Total Communications Software $20,000. 48.1% Hardware $18,000. 43.3% Databases $2,000. 4.8% Communications Hardware $1,000. 2.4% Facilities $580. 1.4% Documentation $1. 0.0% Applications $0. 0.0% Cash Accounts $0. 0.0% Accounts Payable $0. 0.0% Accounts Receivable $0. 0.0% Intangibles $0. 0.0% Personnel $0. 0.0% Procedures $0. 0.0% Security $0. 0.0% Support Systems $0. 0.0% System Software $0. 0.0% FIGURE 4 This information is presented below as a barchart. 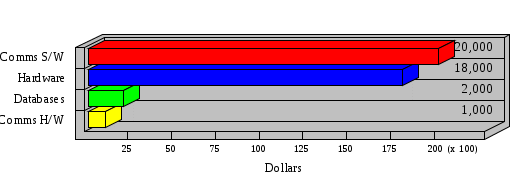   FIGURE 5 The percentage of the total replacement cost for each category is indicated in the following diagram. 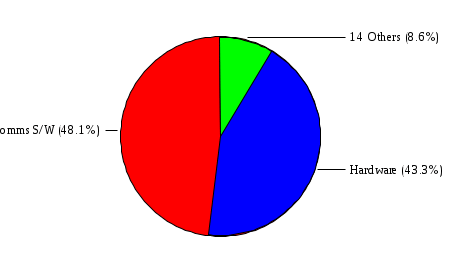 FIGURE 6 3.2 INCIDENTS INVOLVING EACH THREAT Each Incident is defined as triple of the form The sections below look at each threat and indicate the various incidents that were associated with it in the analysis. For each incident, a table is presented (FIGURES 13.1, 13.2, ...) indicating its SLE and ALE (where the ALE is generated by multiplying the SLE for the incident by the AFE of the threat). The overall ALE for a threat is the sum of the ALEs for each of the associated incidents. This is shown as the total of the third column. The percentage of this total represented by the ALE for each incident is indicated in the fourth column. Also shown for each threat is a barchart that provides a visual presentation of the relative magnitudes of the ALE for each incident. These are shown as FIGURES 14.1, 14.2, .... Piecharts are then also provided that indicate the percentage of each threat ALE that is accounted for by each incident that is used in its calculation. 3.2.1 Blackmail - AFE: 0.05 The various incident classes associated with this threat are shown in the following table: Incident Class SLE ALE % of total ALE Modification, Databases $1,944,100. $97,206. 65.7% Direct Loss, Hardware $864,000. $43,200. 29.2% Disclosure, Databases $96,000. $4,800. 3.2% Direct Loss, Databases $40,000. $2,000. 1.4% Intangibles, Databases $8,000. $400. 0.3% Disclosure, Communications Software $4,800. $240. 0.2% Delays/Denials, Hardware $609. $30. 0.0% Disclosure, Documentation $100. $5. 0.0% Direct Loss, Accounts Payable $0. $0. 0.0% Direct Loss, Accounts Receivable $0. $0. 0.0% Direct Loss, Cash Accounts $0. $0. 0.0% Delays/Denials, Accounts Payable $0. $0. 0.0% Delays/Denials, Accounts Receivable $0. $0. 0.0% Direct Loss, Documentation $2. $0. 0.0% Direct Loss, Personnel $0. $0. 0.0% Delays/Denials, Cash Accounts $0. $0. 0.0% Delays/Denials, Databases $0. $0. 0.0% Delays/Denials, Documentation $0. $0. 0.0% Disclosure, Personnel $0. $0. 0.0% Delays/Denials, Personnel $0. $0. 0.0% Intangibles, Documentation $2. $0. 0.0% Intangibles, Intangibles $0. $0. 0.0% Figure 13.1    Figure 14.1 Blackmail - ALE's 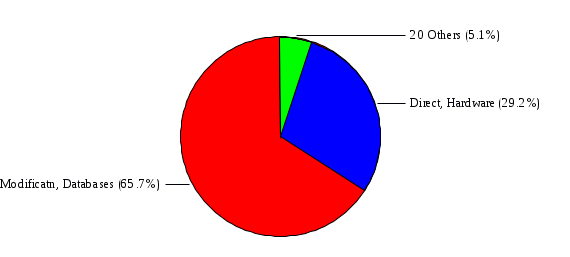 Figure 15.1 Blackmail - ALE's     Figure 16.1 Blackmail - SLE's 3.2.2 Budget Loss - AFE: 0.50 The various incident classes associated with this threat are shown in the following table: Incident Class SLE ALE % of total ALE Intangibles, Intangibles $0. $0. 0.0% Figure 13.2 3.2.3 Communication Loss - AFE: 100.00 The various incident classes associated with this threat are shown in the following table: Incident Class SLE ALE % of total ALE Delays/Denials, Communications Hardware $48. $4,759. 57.6% Direct Loss, Communications Hardware $35. $3,500. 42.4% Related Direct Loss, Personnel $0. $0. 0.0% Related Direct Loss, Communications Hardware $0. $0. 0.0% Delays/Denials, Personnel $0. $0. 0.0% Figure 13.3  Figure 14.3 Communication Loss - ALE's  Figure 15.3 Communication Loss - ALE's  Figure 16.3 Communication Loss - SLE's 3.2.4 Data Destruction - AFE: 20.00 The various incident classes associated with this threat are shown in the following table: Incident Class SLE ALE % of total ALE Modification, Databases $2,801. $56,001. 61.8% Direct Loss, Databases $1,000. $20,000. 22.1% Delays/Denials, Databases $635. $12,691. 14.0% Delays/Denials, Communications Software $95. $1,903. 2.1% Related Direct Loss, System Software $0. $0. 0.0% Related Direct Loss, Databases $0. $0. 0.0% Delays/Denials, Applications $0. $0. 0.0% Related Direct Loss, Communications Software $0. $0. 0.0% Related Direct Loss, Applications $0. $0. 0.0% Delays/Denials, System Software $0. $0. 0.0% Figure 13.4  Figure 14.4 Data Destruction - ALE's 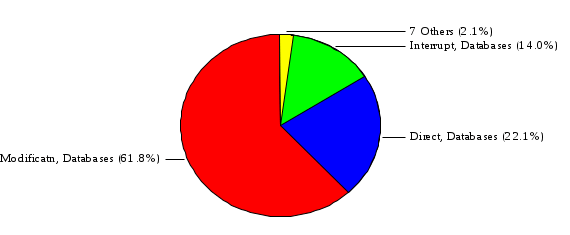 Figure 15.4 Data Destruction - ALE's   Figure 16.4 Data Destruction - SLE's 3.2.5 Data Disclosure - AFE: 3.00 The various incident classes associated with this threat are shown in the following table: Incident Class SLE ALE % of total ALE Intangibles, Databases $1,400. $4,200. 87.5% Disclosure, Databases $200. $600. 12.5% Intangibles, Intangibles $0. $0. 0.0% Figure 13.5  Figure 14.5 Data Disclosure - ALE's 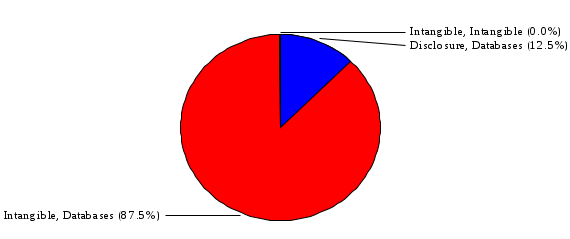 Figure 15.5 Data Disclosure - ALE's  Figure 16.5 Data Disclosure - SLE's 3.2.6 Errors, General/All - AFE: 150.00 The various incident classes associated with this threat are shown in the following table: Incident Class SLE ALE % of total ALE Delays/Denials, Databases $77. $11,422. 47.5% Delays/Denials, Hardware $64. $9,518. 39.6% Delays/Denials, Communications Software $12. $1,903. 7.9% Direct Loss, Communications Hardware $4. $749. 3.1% Delays/Denials, Communications Hardware $3. $475. 2.0% Related Direct Loss, Accounts Receivable $0. $0. 0.0% Related Direct Loss, Accounts Payable $0. $0. 0.0% Modification, Applications $0. $0. 0.0% Related Direct Loss, Personnel $0. $0. 0.0% Direct Loss, Cash Accounts $0. $0. 0.0% Direct Loss, Accounts Receivable $0. $0. 0.0% Direct Loss, Accounts Payable $0. $0. 0.0% Delays/Denials, Accounts Payable $0. $0. 0.0% Delays/Denials, Accounts Receivable $0. $0. 0.0% Delays/Denials, Applications $0. $0. 0.0% Related Direct Loss, Hardware $0. $0. 0.0% Related Direct Loss, Databases $0. $0. 0.0% Related Direct Loss, Communications Hardware $0. $0. 0.0% Related Direct Loss, Applications $0. $0. 0.0% Delays/Denials, Personnel $0. $0. 0.0% Delays/Denials, System Software $0. $0. 0.0% Figure 13.6   Figure 14.6 Errors, General/All - ALE's 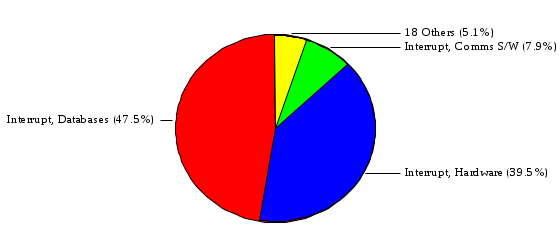 Figure 15.6 Errors, General/All - ALE's  Figure 16.6 Errors, General/All - SLE's 3.2.7 Fire, Major - AFE: 0.05 The various incident classes associated with this threat are shown in the following table: Incident Class SLE ALE % of total ALE Direct Loss, Hardware $3,901. $196. 84.8% Delays/Denials, Hardware $318. $16. 6.9% Direct Loss, Communications Hardware $200. $10. 4.3% Direct Loss, Facilities $145. $7. 3.2% Delays/Denials, Communications Hardware $79. $3. 1.7% Direct Loss, Documentation $0. $0. 0.0% Direct Loss, Personnel $0. $0. 0.0% Delays/Denials, Documentation $0. $0. 0.0% Direct Loss, Support Systems $0. $0. 0.0% Delays/Denials, Facilities $15. $0. 0.3% Delays/Denials, Personnel $0. $0. 0.0% Delays/Denials, Support Systems $0. $0. 0.0% Figure 13.7   Figure 14.7 Fire, Major - ALE's 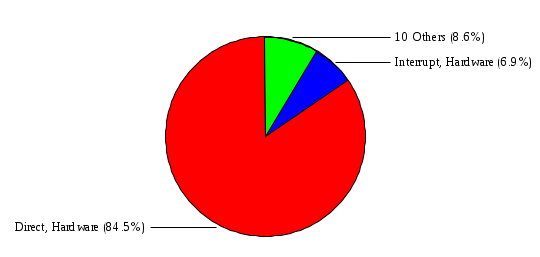 Figure 15.7 Fire, Major - ALE's   Figure 16.7 Fire, Major - SLE's 3.2.8 Flooding/Water Damage - AFE: 0.01 The various incident classes associated with this threat are shown in the following table: Incident Class SLE ALE % of total ALE Delays/Denials, Hardware $305. $4. 60.9% Delays/Denials, Communications Hardware $153. $2. 30.5% Direct Loss, Communications Hardware $200. $1. 40.0% Direct Loss, Facilities $58. $0. 11.6% Direct Loss, Support Systems $0. $0. 0.0% Related Direct Loss, Facilities $0. $0. 0.0% Delays/Denials, Facilities $9. $0. 1.9% Delays/Denials, Personnel $0. $0. 0.0% Figure 13.8  Figure 14.8 Flooding/Water Damage - ALE's 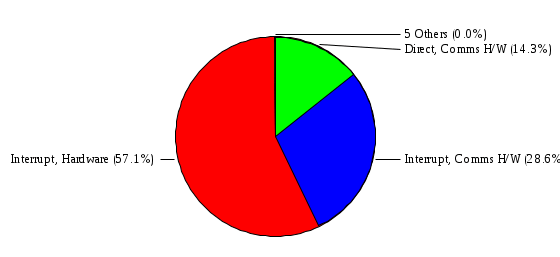 Figure 15.8 Flooding/Water Damage - ALE's   Figure 16.8 Flooding/Water Damage - SLE's 3.2.9 Fraud/Embezzlement - AFE: 1.00 The various incident classes associated with this threat are shown in the following table: Incident Class SLE ALE % of total ALE Modification, Communications Software $146. $146. 100.0% Modification, System Software $0. $0. 0.0% Intangibles, Intangibles $0. $0. 0.0% Modification, Cash Accounts $0. $0. 0.0% Modification, Applications $0. $0. 0.0% Modification, Accounts Receivable $0. $0. 0.0% Modification, Accounts Payable $0. $0. 0.0% Figure 13.9  Figure 14.9 Fraud/Embezzlement - ALE's  Figure 16.9 Fraud/Embezzlement - SLE's 3.2.10 Hardware Failure - AFE: 70.00 The various incident classes associated with this threat are shown in the following table: Incident Class SLE ALE % of total ALE Direct Loss, Hardware $270,000. $18,900,000. 99.0% Related Direct Loss, Hardware $2,855. $199,874. 1.0% Delays/Denials, Personnel $0. $0. 0.0% Figure 13.10   Figure 14.10 Hardware Failure - ALE's  Figure 15.10 Hardware Failure - ALE's   Figure 16.10 Hardware Failure - SLE's 3.2.11 Misuse: Computer - AFE: 5.00 The various incident classes associated with this threat are shown in the following table: Incident Class SLE ALE % of total ALE Delays/Denials, Hardware $191. $952. 66.7% Delays/Denials, Communications Software $95. $475. 33.3% Delays/Denials, Personnel $0. $0. 0.0% Delays/Denials, Support Systems $0. $0. 0.0% Delays/Denials, System Software $0. $0. 0.0% Figure 13.11  Figure 14.11 Misuse: Computer - ALE's 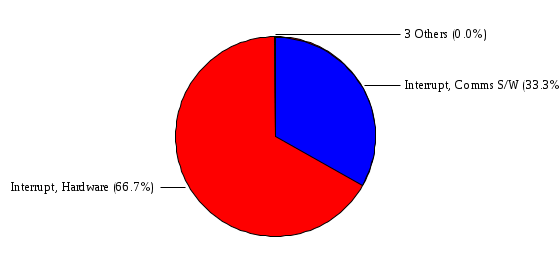 Figure 15.11 Misuse: Computer - ALE's  Figure 16.11 Misuse: Computer - SLE's 3.2.12 Pirating Key Personnel - AFE: 1.00 The various incident classes associated with this threat are shown in the following table: There are no incidents associated with this threat. 3.2.13 Power Loss - AFE: 12.00 The various incident classes associated with this threat are shown in the following table: Incident Class SLE ALE % of total ALE Delays/Denials, Hardware $51. $610. 62.6% Delays/Denials, Communications Hardware $25. $304. 31.3% Delays/Denials, Facilities $5. $60. 6.1% Delays/Denials, Personnel $0. $0. 0.0% Figure 13.13  Figure 14.13 Power Loss - ALE's 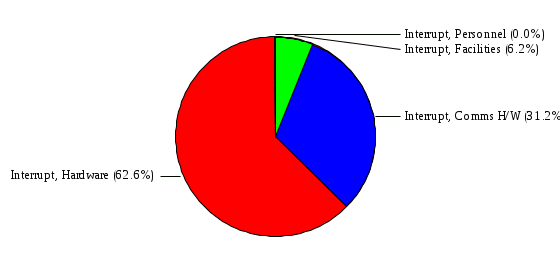 Figure 15.13 Power Loss - ALE's  Figure 16.13 Power Loss - SLE's 3.2.14 Resource Mismanagement - AFE: 5.00 The various incident classes associated with this threat are shown in the following table: There are no incidents associated with this threat. 3.2.15 Sabotage - AFE: 0.10 The various incident classes associated with this threat are shown in the following table: Incident Class SLE ALE % of total ALE Direct Loss, Hardware $9,000. $901. 89.6% Direct Loss, Communications Hardware $500. $51. 5.0% Direct Loss, Facilities $290. $29. 2.9% Delays/Denials, Hardware $204. $21. 2.0% Delays/Denials, Communications Hardware $50. $5. 0.5% Related Direct Loss, Facilities $0. $0. 0.0% Related Direct Loss, Personnel $0. $0. 0.0% Delays/Denials, Facilities $9. $0. 0.1% Delays/Denials, Personnel $0. $0. 0.0% Figure 13.15   Figure 14.15 Sabotage - ALE's 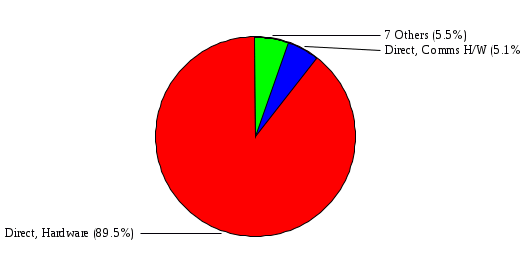 Figure 15.15 Sabotage - ALE's   Figure 16.15 Sabotage - SLE's 3.2.16 Substance Abuse - AFE: 4.00 The various incident classes associated with this threat are shown in the following table: Incident Class SLE ALE % of total ALE Related Direct Loss, Personnel $0. $0. 0.0% Delays/Denials, Personnel $0. $0. 0.0% Figure 13.16 3.2.17 Theft of Assets - AFE: 5.00 The various incident classes associated with this threat are shown in the following table: Incident Class SLE ALE % of total ALE Direct Loss, Hardware $901. $4,501. 67.0% Delays/Denials, Hardware $318. $1,587. 23.6% Delays/Denials, Communications Hardware $76. $380. 5.7% Direct Loss, Communications Hardware $50. $250. 3.7% Figure 13.17  Figure 14.17 Theft of Assets - ALE's 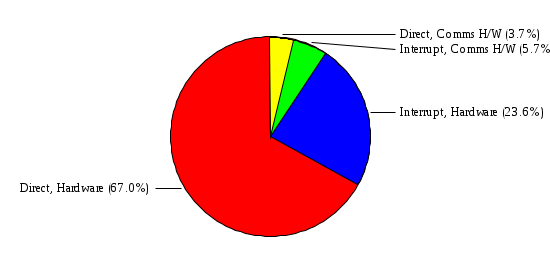 Figure 15.17 Theft of Assets - ALE's  Figure 16.17 Theft of Assets - SLE's 3.2.18 Theft of Data - AFE: 5.00 The various incident classes associated with this threat are shown in the following table: Incident Class SLE ALE % of total ALE Direct Loss, Databases $1,800. $9,000. 56.4% Intangibles, Databases $1,000. $5,000. 31.3% Disclosure, Databases $200. $1,000. 6.3% Delays/Denials, Databases $191. $952. 6.0% Related Direct Loss, Databases $0. $0. 0.0% Figure 13.18  Figure 14.18 Theft of Data - ALE's 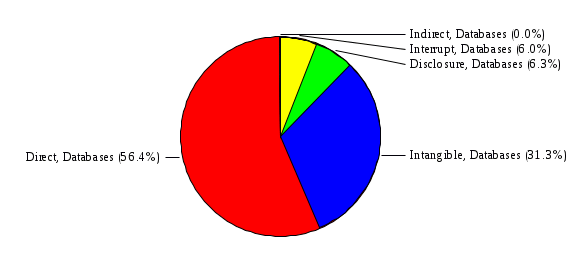 Figure 15.18 Theft of Data - ALE's  Figure 16.18 Theft of Data - SLE's 3.2.19 Vandalism/Rioting - AFE: 1.00 The various incident classes associated with this threat are shown in the following table: Incident Class SLE ALE % of total ALE Delays/Denials, Facilities $16. $16. 93.3% Direct Loss, Facilities $2. $2. 6.7% Figure 13.19  Figure 14.19 Vandalism/Rioting - ALE's 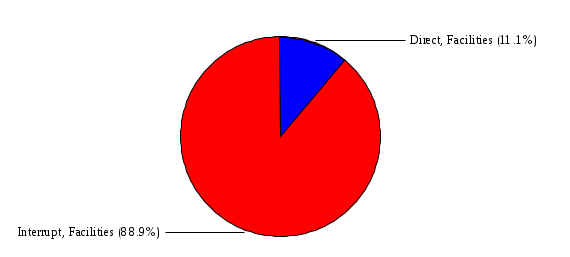 Figure 15.19 Vandalism/Rioting - ALE's  Figure 16.19 Vandalism/Rioting - SLE's CHAPTER 3. THREATS Altogether [[[thirty]]] threats were considered in the analysis. Each was assigned a locally applicable estimate of frequency. Each was associated with one or more pairs composed of a Loss Category and an Asset Category to form a number of distinct incidents. Using other data about the expected degree of seriousness for each incident, the vulnerability of [[[The Agency]]] in a variety of area (derived from the responses to questions sent to users of the system being analyzed and reported on thoroughly below in Chapter 4 of this report), the single loss expectancy (SLE) for every incident was computed; when multiplied by the expected frequency of the threat included in the incident definition, the Annual Loss Expectancy (ALE) can be calculated. The ALE for all incidents that are associated with a particular threat are added to determine an ALE attributable to that threat. The single threat with the greatest Annual Loss Expectancy (ALE) is Hardware Failure with a value of $19,099,875.. This value accounts for 98.4 percent of the total ALE for the enterprise. The next highest values of ALE arise from threats Blackmail and Data Destruction. The values and percentages of the whole are, respectively, $147,880., at 0.8% and $90,594. at 0.5%. [[[The reason for the size of the Data Destruction ALE is the lack of a published Contingency Plan. It is anticipated that the Plan will be ready for publication by July 30. 1993. The Plan should significantly reduce the DATA CENTER's vulnerability to the threat of Data Destruction.]]] 3.1 SUMMARY OF THREATS A multitude of threats have been analyzed in order to develop a viable set of threats which is further analyzed for applicability to the specific organizational system. For each threat, an Annual Frequency Estimate (AFE) is derived by analyzing available national data. Following is a description of the methodology used in deriving the various AFE's which are subsequently employed in calculating the Annual Loss Expectancies (ALE's). Raw data with dates of occurrence, dollar losses, and resources threatened are obtained from a multitude of data bases including data from the National Technical Information Center (NTIS) and the Defense Technical Information Center (DTIS). Some of the raw data are available in automated regional systems with on-line query, some are available in magnetic media but not on-line, and some can only be found in hard copy form. The collected data are analyzed by use of statistical routines to derive the mean, the standard deviation, and the regression slope. These data are organize DATA RELEVANCE The derived AFE values developed from the national data, are not as applicable as AFE's developed with site specific data. Site specific data are defined as information gathered directly on or from the site itself. Historically recorded data of previous threat occurrences which can generally be collected from the specific site are; maintenance logs, documentation on system operations and system failures, air conditioning and power failure, and component mean-time between failure reports, etc. To determine whether or not the suggested AFE value, for a given threat should be used, is a straightforward process: 1) When possible, the AFE value for the given threat is developed from site specific/resident data. This requires the gathering of site resident data as needed to calculate the mean and standard deviation for any specific threat AFE. Examples of threats which are best represented by site specific data are: Air conditioning failures, power outages, operator errors, user input errors, system crashes, and theft. 2) When it is not practical to gather the site specific data required to calculate the AFE value for a particular threat, the standard AFE value can be used. The Table (FIGURE 10) below shows the threats that were considered in this analysis together with their local Annual Frequency Estimates (AFE), the ALE of all incidents associated with each, and the percentage of the overall ALE represented by each of these ALE figures. Threat AFE ALE % of Total ALE Hardware Failure 70.00 $19,099,875. 98.4% Blackmail 0.05 $147,880. 0.8% Data Destruction 20.00 $90,594. 0.5% Errors, General/All 150.00 $24,069. 0.1% Theft of Data 5.00 $15,952. 0.1% Communication Loss 100.00 $8,259. 0.0% Theft of Assets 5.00 $6,717. 0.0% Data Disclosure 3.00 $4,799. 0.0% Misuse: Computer 5.00 $1,428. 0.0% Sabotage 0.10 $1,005. 0.0% Power Loss 12.00 $975. 0.0% Fire, Major 0.05 $233. 0.0% Fraud/Embezzlement 1.00 $145. 0.0% Vandalism/Rioting 1.00 $19. 0.0% Flooding/Water Damage 0.01 $8. 0.0% Substance Abuse 4.00 $0. 0.0% Budget Loss 0.50 $0. 0.0% Resource Mismanagement 5.00 $0. 0.0% Pirating Key Personnel 1.00 $0. 0.0% FIGURE 10 This ALE information is presented below as a barchart.   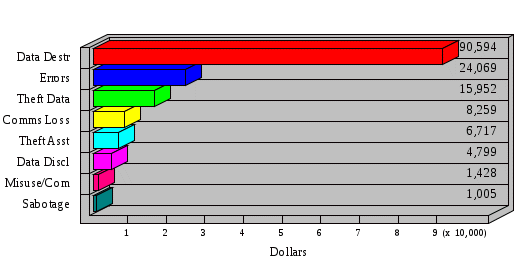 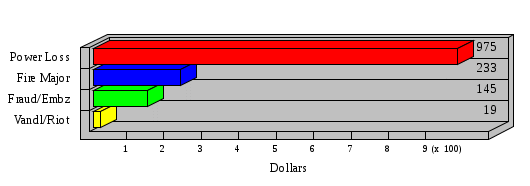  FIGURE 11 The percentage of the total ALE for each threat is indicated in the following diagram.  FIGURE 12 The definitions of the threats follow: THREAT DEFINITIONS 1. AIR CONDITIONING FAILURE - Air Conditioning Failure. This threat is a major cause of computer malfunctions. Both hardware and software should be kept at 70-90 degrees F. to assure proper functioning. High temperatures may cause semi-conductors to break down and produce flawed data. Local Data is usually available on failures per year. 2. AIRCRAFT ACCIDENT - The threat of aircraft accident has increased over the last thirty years. Frequency of occurrence is increased over 100 times if the facility is located near the flight path. Frequency also increased if the facility is located near the take-off or landing pattern of an airport. 3. BIOLOGICAL CONTAMINATION - Biological contamination refers to the threat of contagious disease in a work environment. Unsanitary conditions in a common lunchroom may spread flu or cold viruses. Recirculating air conditioning systems can cause respiratory problems including Legionnaire's Disease. 4. BLACKMAIL - Blackmail is a threat to an individual who is in a position to get sensitive information from the computer, to modify or destroy data. If the computer center handles financial, sensitive, or privacy information, this threat increases. 5. BOMB THREATS - Because Bomb Threats are potentially very destructive, they must be taken seriously, and so can be used by insiders to create an opportunity for theft, or data modification. A related loss is personnel time and work lost. 6. BUDGET LOSS - Budget loss can threaten any department or agency which must submit budgets and get approval for continued funding. Budget cuts in the ADP center may result in loss of prime resources, from personnel to technical equipment. 7. CHEMICAL SPILLS - Chemical spills may immobilize computer center personnel, cause widespread illness, or prevent employees from reaching their jobs. This threat is more likely to occur when the computer center is located in a highly industrial area. 8. COLD/FROST/SNOW - Cold/Frost/Snow are a major threat in many areas of the U.S. Cooling systems can freeze, pipes can rupture, crack and burst. At risk are water pipes, fuel pipes, and lubricating systems. 9. COMMUNICATION LOSS - Communications failure covers breakdown in the communication system including the operator, phone lines, communication concentrator, wires, hardware and software related to this system. NOTE: Does not include internal communication between computer components. 10. DATA DESTRUCTION - Data Destruction covers all the ways that computer data can be destroyed, including inadvertent error, program "bugs", overt acts, covert acts (by insiders), and computer viruses. 11. DATA DISCLOSURE - Data Disclosure always results in a loss to the legitimate data owner, and gain to the competitor (incl. foreign govt's.). Disclosure can cause the death of a special agent, bad publicity for the responsible agency, or the loss of secret formulas. 12. DATA INTEGRITY LOSS - The loss of Data Integrity deals with corruption of computer data, reducing confidence in the accuracy of the data by the end user. Also refers to insider tampering to increase pay, or adding money to personal accounts. 13. EARTHQUAKES - The threat of earthquake combines several other threats including the explosions resulting from gas leaks after the quake, major and minor fires, loss through injury and loss of life. 14. ERRORS GENERAL/ALL - Error and reduced efficiency are, by definition, unintentional, but they can result in compromising information, loss of data integrity, and data destruction. Errors can be caused by people, faulty programs/equipment or by design flaws. 15. FIRE, CATASTROPHIC - Catastrophic fire refers to a fire involving very large losses. In a catastrophic fire, most of what was threatened is actually lost. 16. FIRE, FALSE ALARM - False alarms effect loss of time in the workplace and loss of efficiency, as well as delays and denials of service to the end users, Most false alarms are caused by fire system detection malfunctions. 17. FIRE, MAJOR - Major fires result in approximately 10% of what is threatened actually being lost. In orders of magnitude, a minor fire occurs 10 times more often than a major fire, and a major fire 10 times more often than a catastrophic fire. 18. FIRE, MINOR - Minor fires occur ten times more often than major fires. In a minor fire, less than one percent of what is threatened is lost. 19. FLOODING/WATER DAMAGE - Flooding and water damage result in destruction due to flooding from storms, broken pipes, or broken dams. Water damage resulting from fire is grouped under the threat of "fire". 20. HARDWARE FAILURE - Hardware and systems failure refer to any failure in the computer hardware, the central processing unit (CPU), memory, and peripherals. These types of failures can result in long delays because the entire system must be restarted after correction. 21. MISUSE COMPUTER - Misuse of computer time is prevalent in most computer centers and is related to personnel using computer resources for their own personal benefit. This type of abuse results in higher usage figures than are real and affect planning. 22. PIRATING KEY PERSONNEL - This threat covers the loss of key employees who represent an investment to the agency in terms of training and staffing. Major losses can result from the loss of proprietary and sensitive information including strategic plans, financial data, internal problems, etc. 23. RESOURCE MISMANAGEMENT - Resource mismanagement refers to poor management practices such as lack of coordination, lack of synergy, lack of planning, and poor use of available resources, including personnel. 24. SABOTAGE - Sabotage and terrorism apply to the placement of explosive devices, destruction by overt or covert means of tangible resources, such as electrical, air conditioning systems, hardware and facilities; as well as intangibles such as information. 25. SINKING GROUND - Subsidence and ground sinking apply only to areas with unstable ground and where much ground shifting (subsidence) can be expected. This is especially important when selecting a new site for a facility. 26. STORMS/HURRICANES - Storms, hurricanes, tornadoes, typhoons, and tsunamis include high velocity winds accompanied by rain, which cause a great deal of damage to anything in their path. Frequency of occurrence estimates vary greatly depending on geographic features. 27. SUBSTANCE ABUSE - Refers to use of alcohol and controlled substances by personnel. Excessive absenteeism, lack of concentration, high turnover, increased accident and error rates; and poor quality work are all related to alcohol and drug abuse. 28. THEFT OF ASSETS - Theft of assets covers the actual loss of resources from both insiders and outsiders. Frequency of occurrence is best obtained from inventory control maintenance records. NOTE: Losses are almost always higher than documented. 29. THEFT OF DATA - Theft of data is extremely difficult to detect. Data can be stolen without being missed. It can be stolen with no physical contact, through communication lines, or by monitoring emanations. Data losses can be extremely damaging. 30. VANDALISM/RIOTING - This threat refers to civil disorder and materializes when company personnel or outsiders behave as a mob, looting, destroying property, disrupting operations and threatening personal safety. |
