пособие Экономика. Учебное пособие по переводу научной литературы (Economics) Москва 2011 Рецензент Гвозданная Надежда Вячеславовна
 Скачать 2.52 Mb. Скачать 2.52 Mb.
|

|
2. The charts below show the main reasons for study among students of different age groups and the amount of support they received from employers. Summarise the information by selecting and reporting the main features, and make comparisons where relevant. 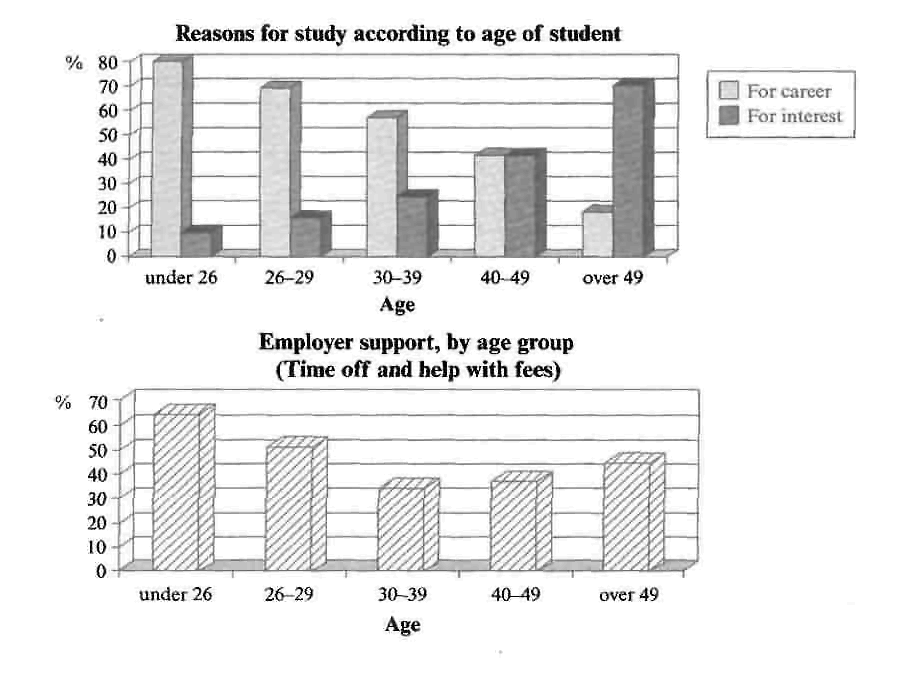 Sample answer The first graph shows that there is a gradual decrease in study for career reasons with age. Nearly 80% of students under 26 years, study for their career This percentage gradually declines by 10-20% every decade Only 40% of 40-49 year olds and 18% of over 49year olds are studying for career reasons in late adulthood. Conversely, the first graph also shows that study stemming from interest increases with age. There are only 10% of under 26уear olds studying out of interest. The percentage increases slowly till the beginning of the fourth decade, and increases dramatically in late adulthood. Nearly same number of 40-49yr olds study for career and interest. However 79% of over 49year olds study for interest in comparison to 18л studying for career reasons in that age group. The second graph shows that employer support is maximum (approximately 60%) for the under 26yr students. It drops rapidly to 32% up to the Third decade of life, and then increases in late adulthood up to about 44%. If is unclear whether employer support is only for career-focused study, but the highest level is for those students who mainly study for career purposes. Assessment This answer summarises the key features of both charts and integrates them well. Clear trends are identified and supported with appropriately-selected figures. The answer could only be improved by adding an introduction to the general topic of the charts. The information is well organised, with a clearly-signalled progression. Linking words are used accurately and precisely, although there is occasional omission. Paragraphing is used well initially, but lapses in the later section. A very good range of vocabulary is used to convey the information concisely and accurately with only occasional inappropriacy. Words are used precisely and there are no errors in spelling or word form. A wide range of structures is used and most sentences in this answer are accurate. Errors are rare and do not affect communication in this answer. 3 The table below gives information about the underground railway systems in six cities. Summarise the information by selecting and reporting the main features, and make comparisons where relevant. Underground Railway Systems
Sample answer The table shows the details regarding the underground railway systems in six cities. London has the oldest underground railway systems among the six cities. It was opened in the year 1863, and it is already 140years old. Paris is the second oldest, in which it was opened in the year 1900. This was then followed by the opening of the railway systems in Тоkyо, Washington DC and Kyoto. Los Angeles has the newest underground railway system, and was only opened in the year 2001. In terms of the site of the railway systems, London, for certain, has the largest underground railway systems. It has 394 kilometres of route in total, which is nеагly twice as large as the system in Paris. Кyotо, in contrast, has the smallest system. It оnly has 11 kilometres of route, which is more than 30 times less than that of London. Interestingly, Tokyo, which оnly has 155 kilometres of route, serves the greatest number of passengers per year, at 1927 millions passengers. The system in Paris has the second greatest number of passengers, at 1191 millions passengers per year. The smalest underground railway system, Kyoto, serves the smallest number of passengers per year as predicted. In conclusion, the underground railway systems in different cities vary a lot in the size of the system, the number of passengers served per year and in the age of the system. Assessment This answer selects and describes the information well. Key features are clearly identified, while unexpected differences are highlighted and illustrated. The answer is relevant and accurate with a clear overview. Information is well-organised using a good range of signals and link words. These are generally accurate and appropriate, although occasional errors occur. The writer successfully uses some less common words. There is a clear awareness of style but there are occasional inaccuracies and there is some repetition. Grammar is well-controlled and sentences are varied and generally accurate with only minor errors. |