Законодательная власть и правоохранительная деятельность в Великобритании и США учебное пособие Уровень В1 Составитель
 Скачать 3.57 Mb. Скачать 3.57 Mb.
|
|
2. Compare your answers with a partner. 3. Speaking 1 Game Board 1. Look at the ‘game board’ below. It has questions about different aspects of crime and criminals. Circulate among your classmates, using the game board to ask questions (one question per classmate). If your classmate can give you a well-developed answer to a question – not just one sentence – write the name of the classmate in that box and make some brief notes about the answer. When you complete three boxes across and three down, stop the activity. Apart from using the verb patterns from Exercise 4 on the previous page, try to use the following:
/Adapted from Academic listening encounters: life in society. Student’s Book. Kim Sanabria/ Speaking 2 Interpreting graphs
Two quotations: 'There are three kinds of lies: lies, damn lies, and statistics.' (Mark Twain) 'He uses statistics as a drunken man uses lamp-posts - for support rather than illumination.' (Andrew Lang) 1. Describing trends 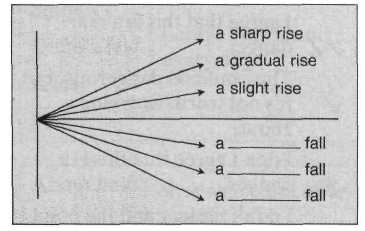 Notice the language patterns that can be used.
/Adapted from New Headway English Course. Upper-Intermediate Student’s Book. Liz and John Soars/ 2. Look at the graphs. The incarceration rate in the USA doubled from 300 to 600 people per 100,000 population. (Incarceration means being put into prison.) Make similar sentences about South Africa, England / Wales, Denmark, the Netherlands and Japan. Which country had the most/fewest people in prison in 1985? Which country had the most/fewest people in prison in 1995? I     ncarceration rate ncarceration rate3 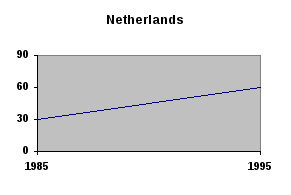 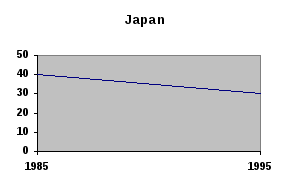 . Work in pairs. Look at the graph and fill in the gaps. . Work in pairs. Look at the graph and fill in the gaps.The graph represents statistics concerning offences involving firearms recorded by the police in England and Wales during the period 1972-90 submitted by the Home Office. The graph shows that in the last quarter of the twentieth century there was a definite (1)___________ in crimes with firearms (guns, rifles etc) in England and Wales. During the period 1972-90 the number of criminal damage offences involving firearms showed (2)____________ from 4,500 to 11,000. From 1972 to 1981 there was a consistent (3)________________ in the number of criminal damage offences. From 1977 to 1978 criminal damage offences rose (4)___________ by (5)__________. During the period 1981-90 each fall in criminal damage offences was followed by (6)___________ . Criminal damage figures (7)_____________ steeply from 1985 to 1988. 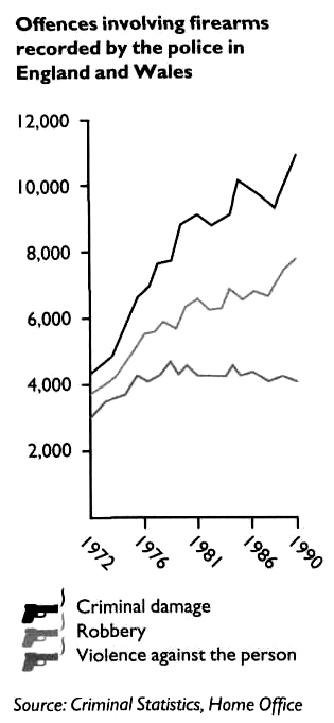 Continue the analysis of the graph with information about robberies and violence against the person involving firearms. Writing Writing a survey report 1. Read the definition of a survey report and do the task that follows.
The results of research can be presented in different ways: A 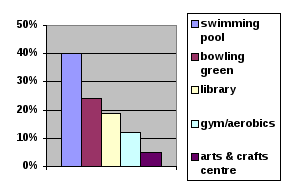  property developer is building a retirement complex. There is some extra space, so they have surveyed prospective residents as to which facility they would like included. property developer is building a retirement complex. There is some extra space, so they have surveyed prospective residents as to which facility they would like included.Pie graph/chart Bar graph/chart The pie chart represents the same results as the bar chart on the left. Can you fill out its sections with percentages? 2. Look at the results of the survey above, then fill in the sentences below with the vocabulary provided.
1. The ______________ of those questioned wanted a swimming pool built. 2. A very small ______________ of the people surveyed were interested in having an arts and crafts centre. 3. A reasonably small ______________ of those who responded wanted a bowling green or library. 4. Twelve ______________ of the people who responded to the survey wished to have a gym included in the facilities. 5. ______________ of those questioned wanted a bowling green. 3. All the sentences in Ex.2 state facts. Generalisations are statements which can help clarify the facts. They can either precede or come after the facts. Depending on their position, facts and generalizations can be linked by using verbs either in their active or passive form as in the examples:
Read the facts and the generalizations listed below, and decide which sentences go together. Link them using one of the two possible ways. Facts: 1. About one quarter of those questioned expressed interest in having a bowling green. 2. By far the largest number of those surveyed responded positively to the idea of having a swimming pool installed. 3. A small minority of those questioned thought that an arts and crafts centre would be a useful addition. 4. Twenty-four per cent of respondents wanted a bowling green and nineteen per cent requested a library. 5. A small proportion of the people asked wanted the developer to build a gym and aerobics studio. Generalisations: a. Some of the prospective residents enjoy taking strenuous exercise. b. Sociable team-sports appeal. c. In general, pensioners do not enjoy creative activities like painting and pottery. d. Among pensioners, relaxing aquatic sports are generally preferred to working out in a gym. e. e. Outdoor activities and reading are quite popular pastimes. 4. Two people were asked to conduct a survey about reading habits. a. Read Model A and underline the facts and circle the generalizations in it. b. Read both models and decide which one
Model A From Michael Green To Prof. White Subject: People’s reading habits Introduction The aim of this report is to analyse the result of a recent survey into people's reading habits. In this survey, people on the street were asked what type of books they read, how often, and where they got their books from. Types of books The most popular type of book for men is thrillers, while for women it is romance. This is shown by the fact that 46% of men read horror books and 53% of women read romances. Both men and women do not find factual books very interesting. Only two in ten men and one in ten women read this type of book. A third of the women surveyed read mysteries, while only a quarter of men read them. Number of books read The most enthusiastic readers are those who read romances. A significant number of them read more than five books a month. Amongst the mystery fans, women read more than men. This is demonstrated by the fact that seven out of ten women read more than three books a month, while only 20% of men read more than two. Source In general people prefer borrowing books from a library to buying their own. Book clubs are also becoming more popular. This is exemplified by the fact that membership of these clubs has increased by 10% over the past ten years. Conclusion In conclusion, this survey indicates that men and women have different reading tastes. Women also tend to read more than men. However, neither men nor women buy many of the books they read, choosing to borrow them instead. Model В I carried out this survey on books by asking people on the street about the books they read. I found out a lot and here are my findings: Firstly, I learned that men read horror stories, while women like romances. I don't like romances myself, but that's not the point here. Neither men nor women like factual books very much. Many people, including me, enjoy eating apples while they read. Women read more mysteries than men, and in general, read more books than men each month. Furthermore, most people borrow their books from libraries rather than buy them. Many more people are members of book clubs now than ten years ago. I used to be in a book club. Are you in one? To sum up, men and women read different kinds of books. Women read more than men. Both men and women borrow a lot of books from libraries so I think maybe bookshops should close down or reduce their prices. 5. Analyse the structure of Report A so that you could add ideas to the plan of a survey report presented below.
6. The chart below gives useful language to be used in survey reports. Look at the examples of the language used in exercises 2, 3 and 4 to add to the expressions in the chart. USEFUL LANGUAGE
| ||||||||||||||||||||||||||||||||||||||||||||||||||||||||
